Help Options
- Online Help web page
- Online update to latest version
 Return to top of document
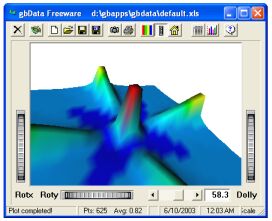
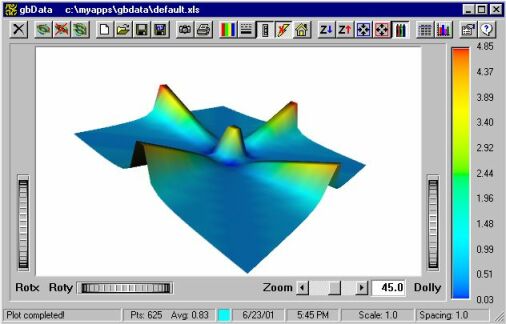
Main Window
gbData allows the user to create a 3D plot data entered in a spreadsheet
format. Excel97 files containing the data may be opened directly or values
may be values may be entered manually into the built-in spreadsheet.
gbData uses four windows. The Main and Data windows are where most
of the work occurs. The Properties and About windows are used as needed.
The Main window contains the 3D display and the Data window provides a
spreadsheet view of the data (Z-axis) values that will be plotted.
gbData is so simple to use that all of its features are accessed
through a single toolbar in each window. Neither the Main nor Data windows
use menus.
The Main window toolbar buttons provide the following functions:
- Exit - quits the gbData application
- Plot - updates the 3D plot
- Clear Display - clears the 3D display (press Plot to re-display the data)
- Stack - directs gbData to append all subsequent plots to the display, separated by the Separation value entered on the properties page
- New - erases all data and clears the display
- Open - opens an existing file (several formats allowed)
- Save - saves the current data without prompting to the current file name
- Save As - opens a dialog window to prompt for a file name to save the data
- Copy Image - puts the 3D image onto the clipboard
- Print - opens a print dialog window for printing the plot data
- Background Color - rotates the background color of the 3D image
- Display Style - roates the display style of the 3D image (point, line, surface)
- Controls - toggles display of the 3D controls
- Antialiasing - toggles use of antialiasing (edge smoothing) of the image
- Home - returns the 3D image to its home position (no rotation)
- Scale Down - increases the Z values (in the display only, does not affect the actual data values)
- Scale Up - decreases the Z values (in the display only, does not affect the actual data values)
- Spacing Decrease - decreases the spacing between data points in the 3D image (has no effect on the actual data values)
- Spacing Increase - increases the spacing between data points in the 3D image (has no effect on the actual data values)
- Spectrum Usage - toggles use of a single color for the 3D image (each spreadsheet can use a different color, up to 3 spreadsheets)
- Data Display - toggles display of the Data window
- Report - displays a popup window with summary information about the contents of the spreadsheet
- Information - shows the About window
- About - shows the About window (shows current application revision information and provides the means for registering the application)
VRML is used as the 3D display file format. Every time a new image is
displayed, gbData creates a temporary file, 'gbData.wrl', which
contains the VRML code for that image. The content of that file may be
viewed by clicking on the left panel of the statusbar. gbData uses Notepad
to view the VRML code. To save a copy of the VRML file of a particular
display, simply call up the VRML code and use the File/SaveAs features of
Notepad to save the file under a different name. Display of subsequent
images will recreate the gbData.wrl file as needed.
Return to top of document
Data Window
This window shows the contents of the opened file (Excel97 and other text
formats are supported), or of the data values entered by the user into the
built-in gbData spreadsheet.
All available Data window functions are contained on the toolbar, which
provides the following functions:
- Exit - quits the Data window, but leaves the Main window open
- Plot - updates the 3D plot
- Clear Display - clears the 3D display (press Plot to re-display the data)
- Stack - directs gbData to append all subsequent plots to the display, separated by the Separation value entered on the properties page
- New - erases all data
- Open - opens an existing file
- Save - saves the current data without prompting to the current file name
- Save As - opens a dialog window to prompt for a file name to save the data
- Cut - puts the selected cells into the clipboard and erases the data
- Copy - puts the selected cells into the clipboard
- Paste - puts the contents of the clipboard into the spreadsheet
- Print - opens a print dialog window for printing the plot data
- Start - moves to the top/left of the spreadsheet
- End - moves to the bottom/right of the spreadsheet
- Column Width - cycles between 3 pre-defined column widths
- Report - displays a popup window with summary information about the contents of the spreadsheet
- Information - shows the About window
- About - shows the About window (shows current application revision information and provides the means for registering the application)
The gbData display is created using the lower/left cell of the spreadsheet
as the lower/left point on the display. Likewise, the upper/rightmost cell
of the spreadsheet is used as the data point for the upper/right point on
the display.
Any spreadsheet cell left empty will be plotted as a zero value.
gbData actually support multiple spreadsheets - the same workbook format
normally used in Excel or other spreadsheet. Pressing the Plot toolbar
button will plot the data contained on the currently selected spreadsheet
of the workbook.
With the Append property checked, each press of the Plot function will
add (not replace) a new image to the 3D display. The object is to allow
viewing of multiple spreadsheets at one time, although you can use Plot
to the the same spreadsheet multiple times.
gbData does not require entry of the XY values. Instead, the array of Z
values is plotted using even spacing (which may be adjusted by the user
to get the best possible display).
Return to top of document
Properties Window
This window
- ScaleFactor - gbData plots the Z values supplied by the user, but sometimes the values are very close and need to be "exagerrated" to show the differences. This setting changes the display height by ScaleFactor but does not change the underlying data contained in the worksheets.
- Spacing - gbData plots the Z values supplied by the user with a separation of 1 unit. Sometimes the display is more easily viewed with different spacing values. This setting changes the display spacing to the value of Spacing but does not change the underlying data contained in the worksheets.
- HiScale - Sets the highest value shown in the legend
- LowScale - Sets the lowest value shown in the legend
- AutoScale - Forces the legend and gradient colors to map to the hi/low data value entered in the spreadsheet.
- User Scale - Forces the legend and gradient colors to map to the HiScale and LowScale values (rather than the max/min data values). This provides a better way to compare two plots whose data ranges are not the same.
- Color1 - Sets the color used for sheet 1 when the Spectrum option is disabled.
- Color2 - Sets the color used for sheet 2 when the Spectrum option is disabled.
- Color3 - Sets the color used for sheet 3 when the Spectrum option is disabled.
- Background - The background of the 3D image can be cycled through 8 different colors.
- Spectrum - 3D images may be plotted as a single color, or using a gradient of colors corresponding to the range of data (red is max, blue is low). This setting toggles between gradient and single colors for plots.
- Angled Startup - The normal, flat 3D view doesn't show the 3D relationship so to eliminate the need for the user to rotate the image each time using the mouse, this setting will automatically rotate the image each time a Plot is executed.
- Reset To Home - gbData usually used the same rotational position when a new Plot is execute. With this setting, you can return to the startup rotational position of the image before a Plot is executed, resulting in the same position for each new plot.
- AutoPlot - Normally, you must manully press Plot to display the data in 3D format. This setting automatically Plots each time a value is changed in the spreadsheet.
- Antialiasing - Adds antialiasing of the image edges to the display. Note: This take significant processor power and will slow down gbData. It is best used to smooth the image before capturing the image with Copy Image.
- Show Controls - Displays the size/rotate controls on the 3D image (note: you can use the mouse for these functions by just left-mouse draggin on the 3D image)
- FocusOnPlot - Set focus to the Main window when a Plot is executed
- Point/Line/Solid - Changes the display mode of the 3D image from point to line to solid (cycles each time you press the toolbar button)
- AutoNumber - Normally, Copy Image names all files gbData.bmp. This property directs gbData to number each image as gbdatXXX.bmp where the XXX cycles from 1 to 999
- BMP - Selects the type of image saved or placed on the clipboard (future versions of gbData will include GIF and JPG options)
- Reset Number - Sets the BMP sequence number to 1
- Set Wallpaper - Sets desktop wallpaper to the 3D image (centered)
- AutoShowData - Automatically displays the Data window on startup
- DataOnTop - Forces the Data window to stay above the Main window
- PlotNewSheet - When selecting a new sheet, causes Plot to be executed automatically
- Open Recent - On startup, causes gbData to automatically open the last opened file
- Append VRML - Causes each new Plot is placed above the existing images, separated by a distanced equal to the Separation property
- Enclose - Adds a surrounding data point at ZMin to create boundaries (walls) around the 3D image
- Separation - When Append is selected, Separation determines how far apart each new image is placed
- None/A-B/A-ZAverage - Creates content for sheet 3 of the workbook. Content created according to the option selected.
- Apply - Saves all property settings, adjust toolbars, and replots data
- Cancel - Closes the Properties window, ignoring all changes made since the window was displayed
- OK - Same as Apply, but also exits the Properties window
Return to top of document
Shortcut Keys
If you'd rather use the keyboard to get around gbData, these shortcut
keys are available:
| Key | Main Window | Data Window
|
|---|
| Ctrl-A | antialiasing | antialiasing
|
| Ctrl-B | - | -
|
| Ctrl-C | Copy image | Cut
|
| Ctrl-D | Data window | Data window
|
| Ctrl-E | Erase image | Erase Image
|
| Ctrl-F | AutoPlot | AutoPlot
|
| Ctrl-G | PlotOnSheetChange | PlotOnSheetChange
|
| Ctrl-H | Go home | Go Home
|
| Ctrl-I | - | -
|
| Ctrl-J | - | -
|
| Ctrl-K | - | -
|
| Ctrl-L | Point/Line/Solid | Point/Line/Solid
|
| Ctrl-M | - | -
|
| Ctrl-N | New | New
|
| Ctrl-O | Controls | Controls
|
| Ctrl-P | Plot | Plot
|
| Ctrl-Q | Append | Append
|
| Ctrl-R | Report | Report
|
| Ctrl-S | Save | Save
|
| Ctrl-T | Data on Top | Data on Top
|
| Ctrl-U | User Scale | User Scale
|
| Ctrl-V | VRML code | Paste
|
| Ctrl-W | Write (print data) | Write (print data)
|
| Ctrl-X | Exit | Cut
|
| Ctrl-Y | - | -
|
| Ctrl-Z | - | -
|